Virtual Prostate Cancer Clinic


This rough draft flyer was created on InDesign for my volunteer position with Brigham and Women’s Radiation Oncology Virtual Prostate Cancer Clinic. It was meant to be the patient’s first introduction to the VPCC when they are enrolled.
Pictocharts: Pregnancy Rate and LARCs
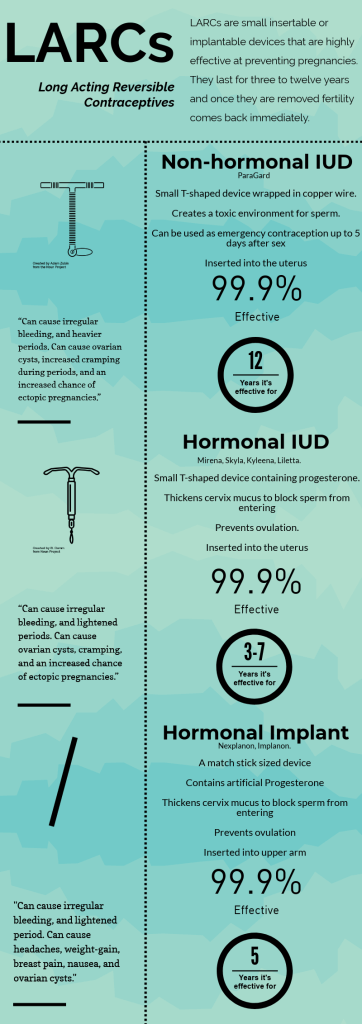
These two Pictocharts are from a final project for Online Journalism in which I wrote about the unintended pregnancy rate in Massachusetts and how long acting reversible contraceptives can help combat them. The first pictochart entitled LARCs explains what a Long acting reversible contraceptive is, the different types of LARCs and how each one works.
While the original article has been deleted from my blog as I don’t believe it was my best work, I am proud of the Pictocharts that I created for it. I feel that the article could have been summed up in the two charts and that besides the few anecdotes in the article did not add much to the story. However, it is a story that I would like to work on again in the future as it is interesting and an important issue.
Even though the article is not up here, I would like to thank all of the women who let me speak to them about their experiences with LARCs. It is a personal topic but these women helped me to fully understand the topic that I was covering.
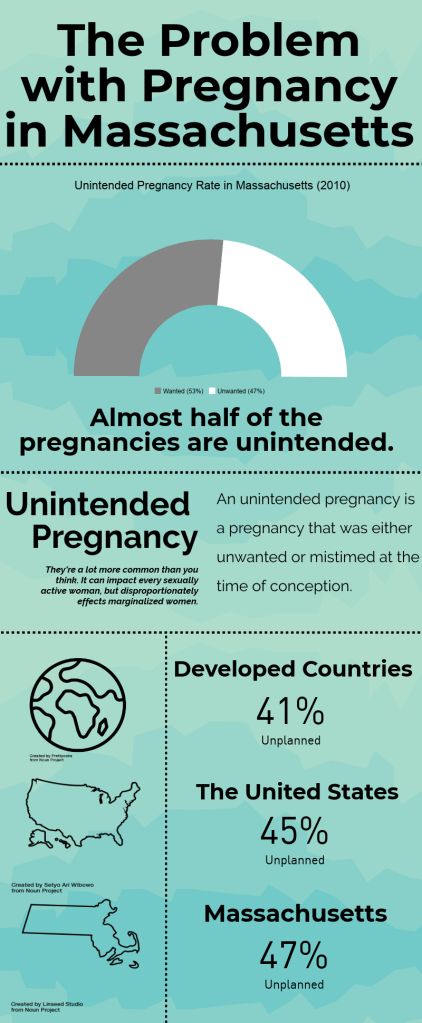
This pictochart depicts the unintended pregnancy rate in Massachusetts. As of 2010 the unintended pregnancy rate was 47% which is about half of all pregnancies. This rate is also higher than the average unintended pregnancy rate of other developed countries. The semi-circle graph clearly depicts this dichotomy and shows the jarring unintended pregnancy rate.
The definition of unintended pregnancy was meant to clarify the initial date. The definition shows that unintended pregnancies does not just mean unwanted but it also means mistimed pregnancies in a couple or a person who otherwise would have wanted a child. This helps to explain why the rate is so high but the abortion and adoption rates aren’t.
I thought that was an important addition to the Pictochart as without the definition the data appears to be skewed or misleading. Hence, the definition was added to avoid being misleading.
Pictochart: The Greek Effect
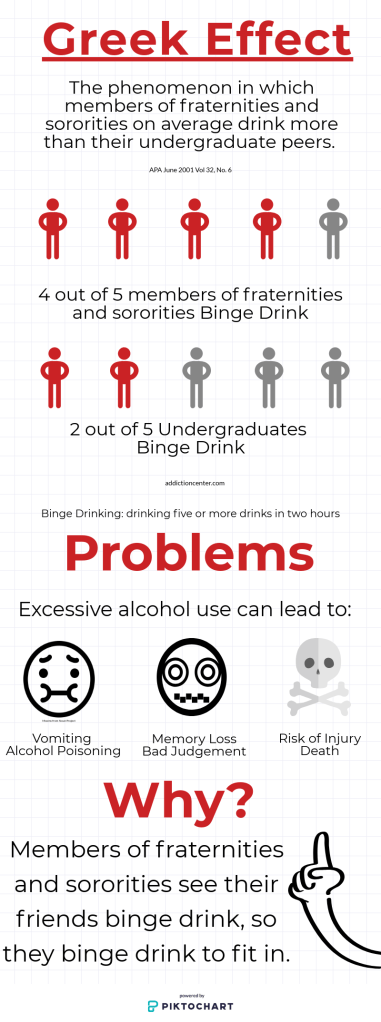
This pictochart was created alongside my Allston after the NIC Hard Alcohol Ban article that can be viewed under the Writing Samples tab.
In the pictochart I show one of the main explanations as to why members of Greek life binge drink more on average than other non-greek life affiliated students.
The people are meant to show how greek-affiliated students binge drink at twice the average rate of students in a simple manner.
I included both the definition of and problems associated with binge drinking to help the reader fully understand the problem.
While the article focused on how the ban may help the problem and what the students of BU think of the issue, this chart shows how the ban could spark an important change in greek life’s alcohol culture even if students don’t initially understand it.
Social Media Posts at WEEI
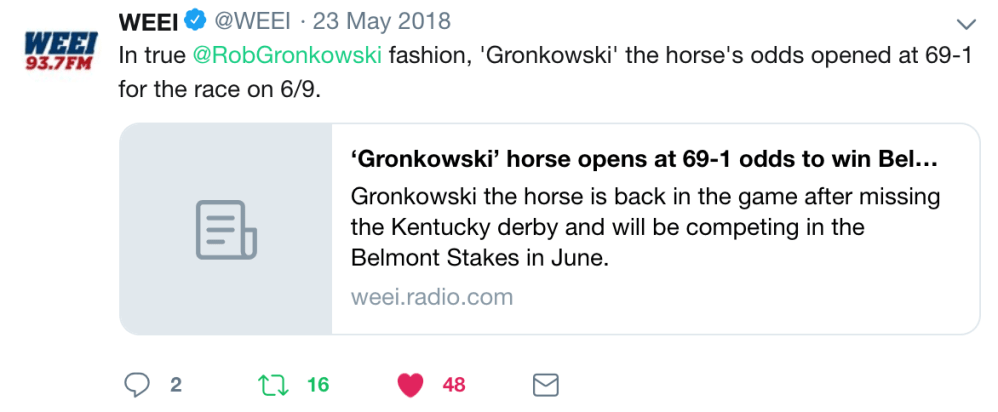

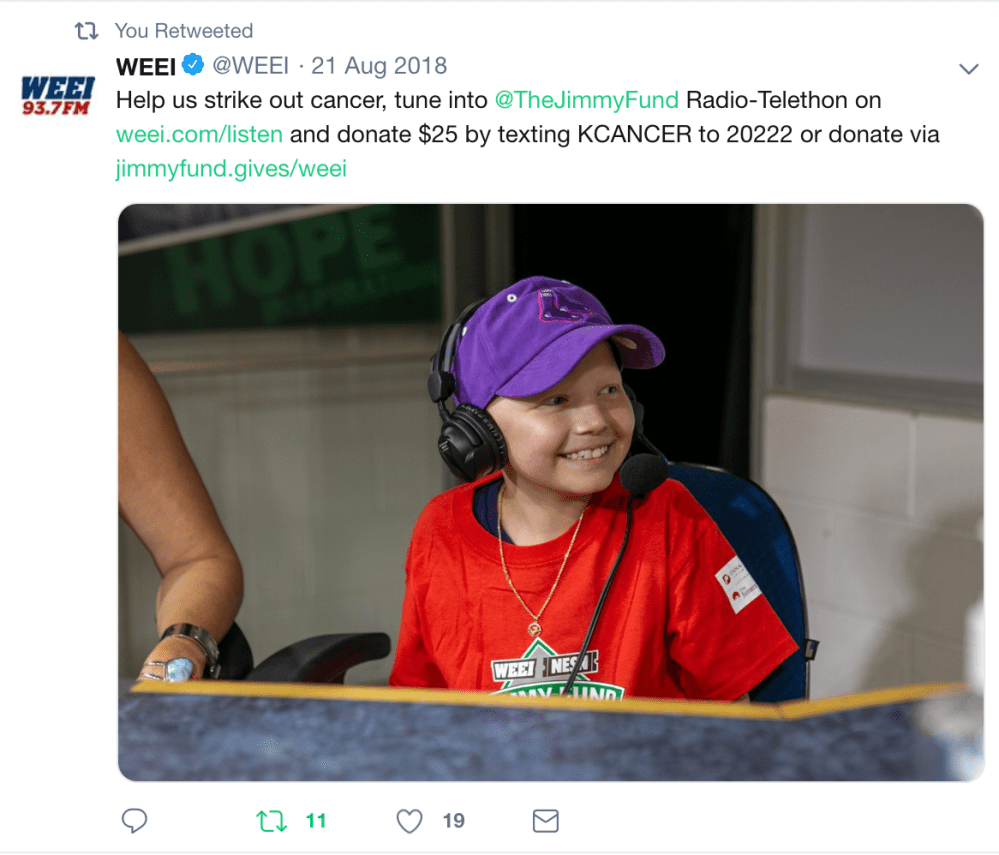

Here are a small sample of social media posts from the time I was at WEEI May to the end of August in 2018. These are only a small amount of the multiple posts I drafted and posted.
Map: Fraternity alcohol related deaths 2008-2018
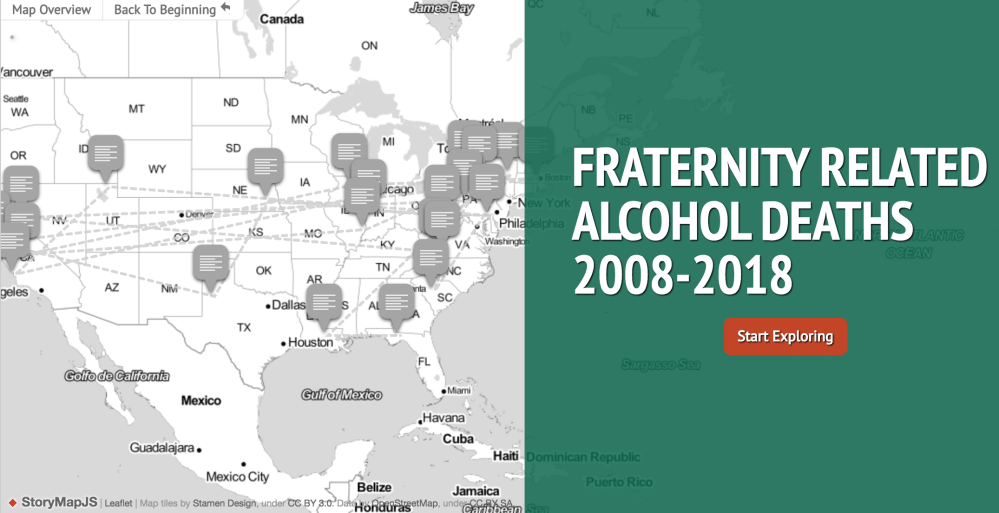
To view the map in full click here, this map is meant to show how often deaths occur in fraternities after binge drinking. The map only shows fraternities rather than all of greek life as fraternity related deaths happen the most frequently and have the most online data. There are some sororities that were found to be co-conspirators in these cases and they too are listed in the information for the map.
